Chandler Trades
What is Elliott Wave Theory?
Elliott Wave was originally developed nearly 100 years ago by Ralph Nelson Elliott. The foundation for his theory was that human psychology drives market participants to operate in repeatable ways. This is true, but it is only a small piece of why wave works… To me, it goes much beyond just psychology and patterns:
My interpretation/application of Elliott Wave is that it is a LANGUAGE used to describe how markets operate. It is the visual display of the negotiation between buyers and sellers... ALL markets (stock market, grocery store, eBay, etc) base price upon where a buyer and seller agree to perform a transaction. Buyers and sellers are constantly negotiating where the next transaction will occur. There is a finite number of ways these negotiations can go. Wave theory categorizes these outcomes into a repeatable language. The categories and rules of this language are as follows:
Impulse Waves:
Impulsive waves represent AGGRESSIVE buyers or sellers, desperate to get in or out of a position.
In an impulsive wave up, buyers are willing to pay any asking price to get in. Discounts are promptly bought up. This results in an aggressive increase in price.
An impulse down is the exact same thing, simply with sellers being desperate to unload.
Impulsive waves contain at least 5 waves. Each of which can be broken down into smaller waves.
Waves 1, 3 and 5 are impulsively with trend.
Waves 2 and 4 represent the ‘pauses’ as price seeks liquidity. These pullbacks are corrective structures and counter trend moves.

Rules:
- Wave 4 can never enter into the range of wave 1 – unless it is part of a diagonal
- Wave 2 can never drop below wave 1’s low
- Wave 3 can never be the smallest wave
Common Measurements (Guidelines, not rules):
- Wave 2: Often a 50%-78.6% retrace of wave 1
- Wave 3: Measured as an extension of wave 1 starting from the bottom of wave 2…. common extensions are 1.272, 1.618 (most common), 2.0, 2.618, 3.618
- Wave 4: Often a 38.2%-50% retrace of wave 3
- Wave 5 is measured as an extension of waves 1-3 from the bottom of wave 4… common extensions are 0.618 (most common), 1.0, 1.618
- Additionally, wave 5 is often equal in length to wave 1, especially when wave 3 ends at the 1.618
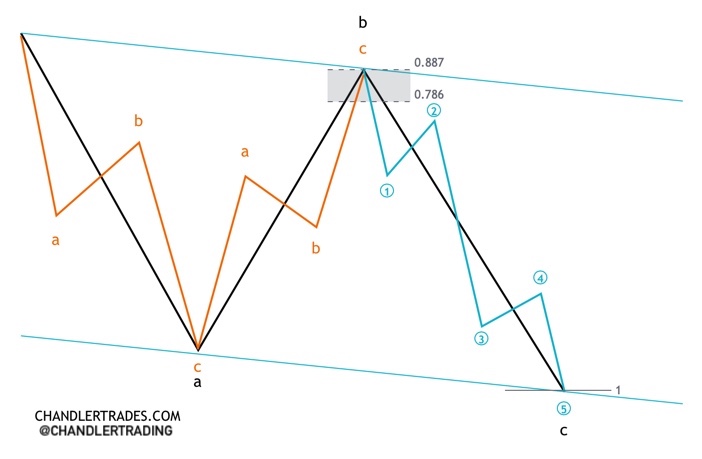
Extended Waves:
In most cases, at least one wave within an impulse ends up being an extended wave. Usually this is wave 3, but that is not always the case. Waves 1 and 5 are capable of become extended, although it is less common. The extended wave(s) can be identified through the sub-waves.

Corrective Waves
While impulsive waves represent desperation/aggression from buyers/sellers, corrective waves occur when that desperation subsides/pauses.
Corrective waves represent price that is seeking LIQUIDITY. This is PASSIVE price action. Not sustained aggression.
This occurs because for a transaction to occur, buyers and sellers have to agree on price. So, if buyers are no longer willing to pay higher prices, sellers will be forced to lower their asking price until it reaches a point that buyers are willing to pay again, in order for that transaction to occur.
This process creates the following structures:
Zig-Zags:
Zig zags are the most direct corrective waves, and subdivide in a 5-3-5 pattern.
Waves A & C will be impulsive in nature and B will be corrective pattern.

Take note of the 5-3-5 subdivision of the main ABC structure
In some cases, wave B may be a triangle. The A and C waves are often similar in length.
Flats:
The structure of a flat correction is 3-3-5
– A is a corrective move
– B is a corrective move
– C is an impulsive move
Flats represent price almost recovering from a pullback, but not having the aggression behind the move to sustain it. The B-wave is the hint, as it will be messy/overlapping, rather than the aggressive nature of a true impulsive move. This leads to the sharp C-wave, as B-wave fails to find follow through.
There are 3 types of flats:
Regular Flat:
Wave B usually retraces most of wave A, although it is a common misconception that this wave must retrace at least 90%. The only requirement of the B wave is that it is corrective.
Expanded Flat:

The expanded flat also has a 3-3-5 structure. The difference in an expanded flat is that wave B will break above the origin of wave A. This ends up as a ‘false breakout’ as weak/late longs chase the move, providing liquidity for strong sellers to step back in at a discount.
Running Flat:

The third type of flat is the running flat. It is very similar to an expanded flat, but wave C is cut short, before reaching the A-wave low.
Take note of the channel that is formed by a running flat.
Running flats can often be confused for a 1,2 set up, making it important to recognize wave B’s corrective structure, which hints that the correction is still in progress.
Triangles:
Triangles represent balance. Where neither bulls nor bears are desperate to get in. This leads to a narrowing range as the negotiation unfolds.

Triangle corrections can NOT occur alone as a wave 2. They may only occur as a stand alone wave 4. If a triangle appears in a wave 2, it must be part of a combination correction. Triangles may be symmetrical, ascending or declining.
Combination Corrections:
Combination corrections are also called ‘complex corrections’, but there is really no need to overthink it. Combination corrections in simple terms: 2 corrective patterns joined together by a counter-trend 3 wave move or triangle.

Combination/Complex Corrections are labeled WXY. The corrections within them are labeled normally (ABC or ABCDE)
Diagonals
Diagonals are semi-impulsive moves that either start or end a structure. In a diagonal, wave 4 will cross into the area of wave 1. This is the only situation in which this overlap can occur. Diagonals are 5 wave moves and can subdivide as either a 5-3-5-3-5 or 3-3-3-3-3 structure.
Diagonals must have either a contracting form (1>3>5), or expanding form (1<3<5).

Diagonals can only form in a few locations:
- Leading Diagonals: Wave 1 of an impulse, or Wave A of a correction
- Ending Diagonals: Wave 5 of an impulse, or Wave C of a correction
- Diagonals cannot form in any other locations
Applying Elliott Wave Analysis
KEY POINTS:
– Elliott Wave is an effective tool, not a crystal ball
– Projections don’t always turn into trade setups
– Form a thesis. Allow price to confirm/disprove your thesis. Act accordingly
Elliott Wave can be a very effective tool… But like any tool, it is only as effective as the person using it.
Proper EWT IS….
- A language to read the price negotiation, determine who’s control and identify possible paths/areas of interest
- Based on an objective set of rules and guidelines
- Best used in conjunction with other methods of analysis
- Constantly adjusting with price
Proper EWT IS NOT…
- A prediction model, or secret code to the market
- A representation of a trader’s bias
- To be used alone and relied solely upon to ‘predict’ future price action
Trading with Elliott Wave:
Every trade should start with a conditional statement:
If Price does _______________ then it is highly probable that the outcome will be _______________
Elliott Wave analysis will give you one or more potential paths that an asset may take. The goal is to narrow down these possible paths to the one that is most probable. This becomes your primary projection. However, you cannot simply assume your projection is correct.
Once you have your main count/projection, it is your job to determine what price action will confirm that you are (probably) correct. This requires multi-timeframe analysis. In order to enter, you are looking for lower time frame price action to confirm your higher time frame projection.
If A, then B. If X, then Y.
No guarantees. No guessing.
Form a thesis –> Wait until price supports/disproves your thesis –> React accordingly.
Conclusion
Congratulations! If you have made it this far, you now have every tool needed to be a successful Elliott Wave trader. From here, apply the things you have learned and practice counting waves. With repetition the patterns will become more and more clear. Thank you for taking the time to read and support my work, I wish you the best in all your trading endeavors!
If you found value from this guide and are interested in more content, consider some of my other resources:
Twitter | Resources | Memberships